It is often remarked the IMD classification of Southwest Monsoon Season & Northeast Monsoon Season has been created with the objective of making record keeping less cumbersome though the actual onset & withdrawals of Monsoons do not fall within the Gregorian Calendar dates as envisaged by humans. It is difficult to bind nature to man made dates isnt it? Similarly one can also make an argument annual rainfall data also falls under the similar category especially for places like Tamil Nadu which sees the effect of Northeast Monsoon spill over into the next calendar year. It is in this context today’s post talks of the Chennai’s year of Bounty.
We all know the annual average for the IMD Station at Chennai Nungambakkam is 140 cms while the annual average for the observatory at Airport is 138 cms. The Chennai weather bloggers have come to realize for the past couple of years or so even within the Greater Chennai Metropolitan area the rainfall numbers vary drastically due to the various personal weather stations maintained by the bloggers. Now with increasing network of automatic weather stations from networks like TNSDMA it is possible to analyze data from a network with homogenous weather stations which is not the case with the weather stations maintained by the weather bloggers.
The trigger to this post was the Localized Flooding / Water logging parts of Chennai witnessed after the incident of extreme rains in parts of the city & suburbs on November 7th. Attributing urban flooding to a single instance of extreme rains is mostly a myopic view because there are far more factors that trigger an episode of urban flooding particularly in a large populous country like India. But the role of rains, particularly sustained rains over a long period of time, need to be taken into account in circumstances like this.
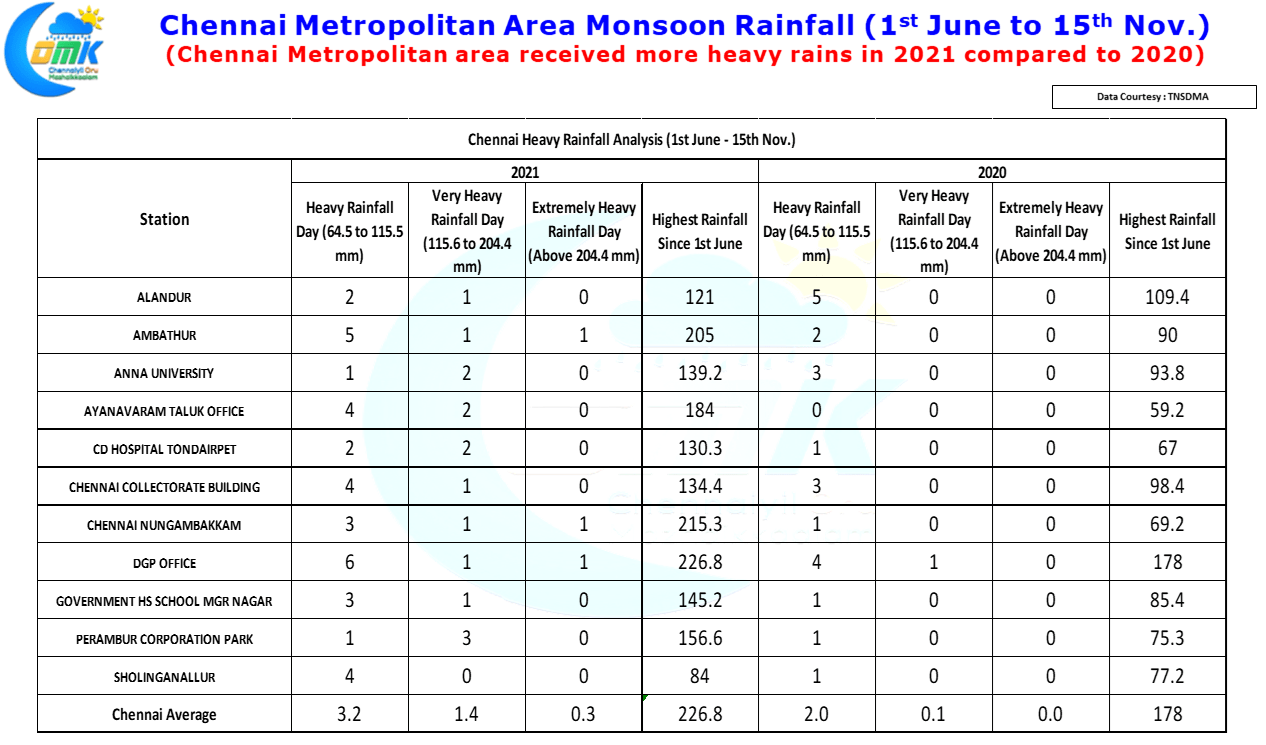
Instead of opting the easier route of saying Chennai has received more rains than normal we have dived deeper into numbers to bring out what has been a year of Bounty for Chennai with Rains. Not only has the city on an average received more rains this year but one key point that has emerged from this number crunching is Greater Chennai Metropolitan area has received more than 40% increased rainy day instances between the period 1st June to 15th Nov. ’21 compared to the previous year.
Taking it back slightly instead of looking 2021 as a calendar year we thought we will look at the annual rainfall numbers of the various TNSDMA stations around Chennai between 16th November ’20 when the Northeast Monsoon started peaking last year to 15th November ’21. This opened up a slightly different dynamics in terms of the rains received around Chennai for the year. On an average the Chennai Metropolitan area has recorded nearly 224 cms of Rainfall during this one year while the DGP Office at Marina has recorded 284 cms of rains for the year, double of what the annual average is for the IMD station at Nungambakkam. Even Nungambakkam’s year total during this period is 54% more than the annual average with an accumulation of 216 cms for the year between 16th Nov. ’20 to 15th Nov.’21. To give a context 2005 saw Chennai record 257 cms so we are not in a domain which is unknown.

On the weather front with the Depression crossing North TN coast near Marakkanam and is expected to move into South Interior Karnataka as a remnant pulse today the rains are expected to move further interior into Interior Karnataka with heavy rains expected in interior areas of Karnataka with some places getting very heavy rains too. Meanwhile rains over Tamil Nadu including Chennai may gradually reduce though a complete stop may not happen immediately.
On behalf of COMK we would like to place our heartfelt appreciation to Adithya R who has been maintaining & updating the daily rainfall data from TNSDMA without which today’s post would not have been possible.


